Clinical resource

The Lab List

The labs worth knowing — and what actually matters clinically.

FNP CREATED | EVIDENCE-BACKED

How to use The Lab List

Reference intervals are not universal. Unless a threshold is standardized for diagnosis or management, ranges in this resource are typical and should be checked against the reporting laboratory. Interpretation should account for age, sex, pregnancy, assay, specimen, medications, acute illness and the patient's baseline.

Reference range

A statistical interval from a reference population. It is not automatically a diagnostic threshold or treatment target.

Trend

A change from baseline may matter before a value becomes formally abnormal. Rate and direction often carry more clinical information than one isolated result.

Pattern

Most important laboratory questions are solved by combinations: Hgb + MCV + RDW + retics; Na + serum osm + urine osm + urine Na; AST/ALT + ALP + bilirubin; creatinine/eGFR + UACR.

Context

Medications, hydration, kidney/liver function, timing, specimen quality and acute physiologic stress can change the number without changing the underlying diagnosis.
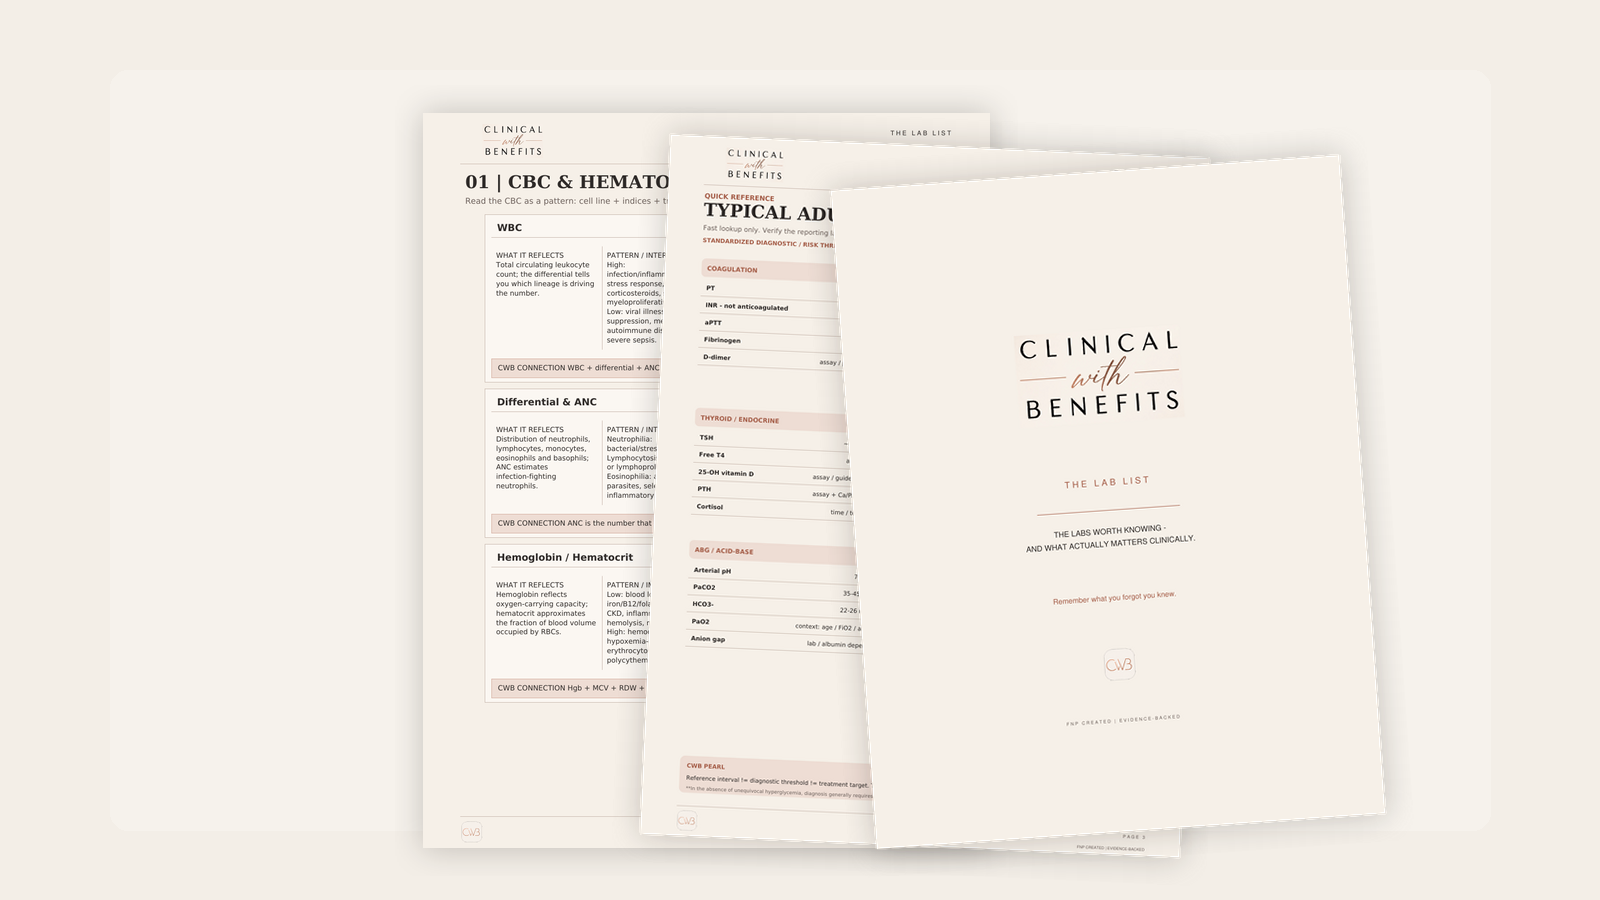
The Lab List branded stacked-page printable preview

Subscriber printable

Keep the full reference handy

Same clinical goodness. Less scrolling.

CBC & hematology

Read the CBC as a pattern: cell line + indices + trajectory + clinical context.

WBC

Typical adult: ~4.0–11.0 x10³/µL; use local range.

What it reflects
Total circulating leukocyte count; the differential tells you which lineage is driving the number.
Pattern / interpretation
High: infection/inflammation, stress response, corticosteroids, smoking, myeloproliferative disease. Low: viral illness, marrow suppression, medications, autoimmune disease, severe sepsis.
CWB connection
WBC + differential + ANC is more clinically useful than WBC alone.

Hemoglobin / hematocrit

Reference intervals vary by sex, age, pregnancy status, altitude and lab.

What it reflects
Hemoglobin reflects oxygen-carrying capacity; hematocrit approximates the fraction of blood volume occupied by RBCs.
Pattern / interpretation
Low: blood loss, iron/B12/folate deficiency, CKD, inflammation, hemolysis, marrow disease. High: hemoconcentration, hypoxemia-driven erythrocytosis, primary polycythemia.
CWB connection
A falling Hgb is a trend problem even if the current value remains inside the reference interval.

MCV / RDW / reticulocytes

MCV typical adult: ~80–100 fL; RDW assay-specific.

What it reflects
Average RBC size, variation in RBC size, and marrow response.
Pattern / interpretation
Low MCV: iron deficiency or thalassemia. High MCV: B12/folate deficiency, alcohol, liver disease, hypothyroidism or reticulocytosis.
CWB connection
Hgb + MCV + RDW + reticulocytes is a fast anemia framework.

Platelets / peripheral smear

Platelets typical adult: ~150–450 x10³/µL.

What it reflects
Circulating platelet number and direct morphology of RBCs, WBCs and platelets.
Pattern / interpretation
Confirm unexpected thrombocytopenia; platelet clumping can create pseudothrombocytopenia. The smear can reveal schistocytes, blasts and other pattern-defining clues.
CWB connection
Thrombocytopenia + hemolysis/organ injury should trigger a broader emergency differential.

Electrolytes & chemistry

Numbers matter, but symptoms, rate of change and physiology determine urgency.

Sodium

Typical: ~135–145 mmol/L.

What it reflects
A marker of water balance relative to body sodium, not a direct measure of total-body sodium stores.
Pattern / interpretation
Low: excess water relative to sodium. High: water deficit relative to sodium. Correct interpretation starts with serum osmolality.
CWB connection
Na + serum osm + urine osm + urine Na is the core hyponatremia pattern.

Potassium / magnesium

K: ~3.5–5.0 mmol/L; Mg: ~1.7–2.4 mg/dL.

What it reflects
Membrane excitability and a cofactor affecting potassium and calcium handling.
Pattern / interpretation
High K: renal dysfunction, RAAS blockers, acidosis, tissue breakdown or pseudohyperkalemia. Low K: GI/renal losses, diuretics or low Mg.
CWB connection
Refractory hypokalemia? Check magnesium.

Bicarbonate / chloride

CO₂: ~22–29 mmol/L; chloride: ~98–106 mmol/L.

What it reflects
Screening clues to metabolic acid-base status and fluid patterns.
Pattern / interpretation
Low bicarbonate can reflect metabolic acidosis or respiratory alkalosis compensation. Interpret with anion gap and chloride.
CWB connection
Low bicarbonate + high anion gap demands a cause, not just replacement.

Calcium / phosphorus

Total calcium: ~8.5–10.5 mg/dL; phosphorus: ~2.5–4.5 mg/dL.

What it reflects
Mineral physiology, bone health and cellular metabolism.
Pattern / interpretation
Albumin changes total calcium; ionized calcium is preferred when binding is abnormal or precision matters. Severe phosphorus depletion can impair muscle, respiratory and cardiac function.
CWB connection
Calcium + PTH + phosphate + vitamin D is the core endocrine/mineral pattern.

Renal

Kidney interpretation is filtration + albuminuria/proteinuria + trajectory + clinical context.

Creatinine / eGFR

Creatinine: ~0.6–1.3 mg/dL; eGFR staging G1–G5.

What it reflects
A filtration surrogate and estimate of glomerular filtration.
Pattern / interpretation
Compare with baseline and timing. A normal creatinine can coexist with reduced GFR in low-muscle-mass patients. One low eGFR is not automatically CKD.
CWB connection
eGFR tells filtration; UACR tells kidney damage/risk. Use both.

UACR / urine protein-creatinine

UACR A1 <30, A2 30–300, A3 >300 mg/g.

What it reflects
Albumin or total protein excretion normalized to urine creatinine.
Pattern / interpretation
Higher albuminuria increases kidney and cardiovascular risk. Transient elevation can occur with exercise, fever, infection and marked hyperglycemia.
CWB connection
Dipstick protein and UACR are not interchangeable.

Urine sodium / FENa / osmolality

Serum osmolality: ~275–295 mOsm/kg.

What it reflects
Renal sodium handling and water balance.
Pattern / interpretation
Diuretics, CKD and mixed physiology limit simplistic FENa interpretation. Urine osmolality tells whether the kidney is appropriately diluting or concentrating.
CWB connection
Urine sediment + history + volume/hemodynamics usually beats a single fractional-excretion number.

Liver & biliary

Separate injury pattern, cholestasis and synthetic function.

AST / ALT / ALP / GGT

AST: ~10–40 U/L; ALT: ~7–56 U/L; ALP: ~44–147 U/L.

What it reflects
Aminotransferases are markers of hepatocellular injury, while ALP/GGT help identify cholestatic or biliary patterns.
Pattern / interpretation
AST also comes from muscle and other tissues; ALT is more liver-enriched. GGT can support hepatobiliary origin of an elevated ALP but is nonspecific.
CWB connection
AST/ALT-dominant = hepatocellular pattern; ALP-dominant = cholestatic pattern.

Bilirubin / albumin / PT-INR

Total bilirubin: ~0.2–1.2 mg/dL; albumin: ~3.5–5.0 g/dL.

What it reflects
Bilirubin processing/excretion and pieces of chronic synthetic context.
Pattern / interpretation
Predominantly indirect bilirubin suggests hemolysis or impaired conjugation; direct elevation suggests excretion problem or cholestasis. Albumin is heavily confounded.
CWB connection
AST/ALT = injury; bilirubin = processing/excretion; albumin/PT-INR = synthetic context.

Cardiac & coagulation

Cardiac biomarkers and coagulation tests answer specific questions; they do not diagnose the entire syndrome by themselves.

High-sensitivity troponin / BNP

Assay-specific; use the reporting lab's assay and pathway.

What it reflects
Myocardial injury and myocardial wall stress.
Pattern / interpretation
A rise/fall suggests acute injury; stable elevation suggests chronic injury. MI requires injury plus evidence of ischemia. BNP/NT-proBNP vary with age, renal function, AF and obesity.
CWB connection
Troponin answers “is there myocardial injury?” The clinical picture answers “why?”

PT/INR / aPTT / anti-Xa

PT: ~11–13.5 sec; INR: ~0.8–1.1 without anticoagulation; aPTT: ~25–35 sec.

What it reflects
Coagulation pathways and anticoagulant effect depending on test and calibration.
Pattern / interpretation
Medication list is mandatory. INR is not a calibrated DOAC level, and anti-Xa must be interpreted by its drug-specific calibration.
CWB connection
Always ask: anti-Xa calibrated for what drug?

Fibrinogen / D-dimer

Fibrinogen: ~200–400 mg/dL; D-dimer is assay/pathway-specific.

What it reflects
Clotting protein and fibrin degradation.
Pattern / interpretation
D-dimer is sensitive to clot turnover but nonspecific. Use it to rule out VTE only in appropriately selected patients within a validated strategy.
CWB connection
DIC is a pattern, not a single laboratory result.

Diabetes, endocrine & nutrition

Separate chronic glycemia, current glucose, hormonal feedback and nutritional patterns.

Glucose / A1C / ketones

Fasting glucose 70–99 mg/dL; A1C normal <5.7%, prediabetes 5.7–6.4%, diabetes ≥6.5%.

What it reflects
Current glucose, longer-term glycemic exposure and ketone production.
Pattern / interpretation
Stress, steroids and acute illness can raise glucose. RBC turnover, anemia and transfusion can distort A1C. Beta-hydroxybutyrate is the dominant ketone in DKA.
CWB connection
Current glucose + A1C helps separate acute stress hyperglycemia from chronic exposure.

TSH / free T4 / cortisol / PTH

TSH: ~0.4–4.0 mIU/L; other assays are context-specific.

What it reflects
Feedback systems for thyroid, adrenal and parathyroid physiology.
Pattern / interpretation
Interpret TSH with free T4. Cortisol needs timing and test strategy. PTH must be read beside calcium, phosphate, vitamin D and kidney function.
CWB connection
Hormones are feedback systems: interpret the axis, not one isolated number.

Iron studies / B12 / folate

Serum iron: ~60–170 mcg/dL; TIBC: ~240–450 mcg/dL; TSAT: ~20–50%.

What it reflects
Iron storage, circulating availability and nutrition relevant to blood cell production.
Pattern / interpretation
Low ferritin strongly supports iron deficiency, while inflammation can make ferritin look reassuring. Neurologic B12 deficiency can occur before dramatic CBC changes.
CWB connection
Ferritin tells storage context; TSAT tells circulating availability.

Inflammatory, infectious & urinalysis

These markers support a clinical hypothesis; they rarely identify the source by themselves.

CRP / ESR / procalcitonin

Assay and protocol-specific.

What it reflects
Inflammation and, in selected contexts, systemic bacterial infection probability.
Pattern / interpretation
CRP and ESR are nonspecific. Procalcitonin can support stewardship in validated settings but does not replace source evaluation or clinical judgment.
CWB connection
Use CRP to follow an inflammatory signal, not to name the diagnosis.

Blood and urine cultures

Interpret organism, collection, number of positive sets and clinical context.

What it reflects
Organisms and susceptibility information.
Pattern / interpretation
True bacteremia vs contamination depends on organism and pattern. Bacteriuria can represent infection, colonization or contamination.
CWB connection
Culture result + patient + source + repeat clearance strategy is the clinical unit.

Urinalysis

Specific gravity: ~1.005–1.030; urine pH: ~4.5–8.0.

What it reflects
Concentration, protein, blood/pigment, urinary inflammation and sediment findings.
Pattern / interpretation
Dipstick and microscopy answer different questions. Pyuria is inflammation, not automatically bacterial infection. Cellular casts can change the differential.
CWB connection
Symptoms + UA pattern + culture when indicated is the right sequence.

Acid-base, lipids & high-acuity labs

Use physiology and the clinical question rather than treating a result in isolation.

Blood gases / anion gap

Arterial pH 7.35–7.45; PaCO₂ 35–45 mmHg; HCO₃⁻ 22–26 mmol/L.

What it reflects
Acidemia/alkalemia, respiratory and metabolic components, and oxygenation when arterial.
Pattern / interpretation
Use a sequence: pH → primary process → expected compensation → anion gap → mixed disorder. Venous PO₂ is not a substitute for arterial oxygenation.
CWB connection
Normal pH does not equal normal acid-base physiology.

Lipids / ApoB / Lp(a)

Triglycerides fasting generally <150 mg/dL; risk thresholds are guideline-specific.

What it reflects
Atherogenic cholesterol, particle burden and inherited risk.
Pattern / interpretation
A normal lab range is not the same as an LDL target for a high-risk patient. ApoB can refine risk when particle burden and LDL-C appear discordant.
CWB connection
Interpret LDL through ASCVD risk, not the reference flag.

Ammonia / lipase / CK / toxicology levels

Lab-, timing- and specimen-specific.

What it reflects
High-acuity physiology, injury and drug exposure.
Pattern / interpretation
Hepatic encephalopathy is clinical; lipase magnitude does not define pancreatitis severity; CK must be paired with renal/electrolyte impact; drug levels require timing.
CWB connection
Drug level without ingestion time is incomplete data.